 ar
ar bg
bg hr
hr cs
cs da
da nl
nl fi
fi fr
fr de
de el
el hi
hi it
it ko
ko no
no pl
pl pt
pt ro
ro ru
ru es
es sv
sv tl
tl iw
iw id
id lv
lv lt
lt sr
sr sk
sk sl
sl uk
uk vi
vi et
et hu
hu th
th tr
tr fa
fa ms
ms hy
hy ka
ka ur
ur bn
bn mn
mn ta
ta kk
kk uz
uz ku
ku
Visualization Software
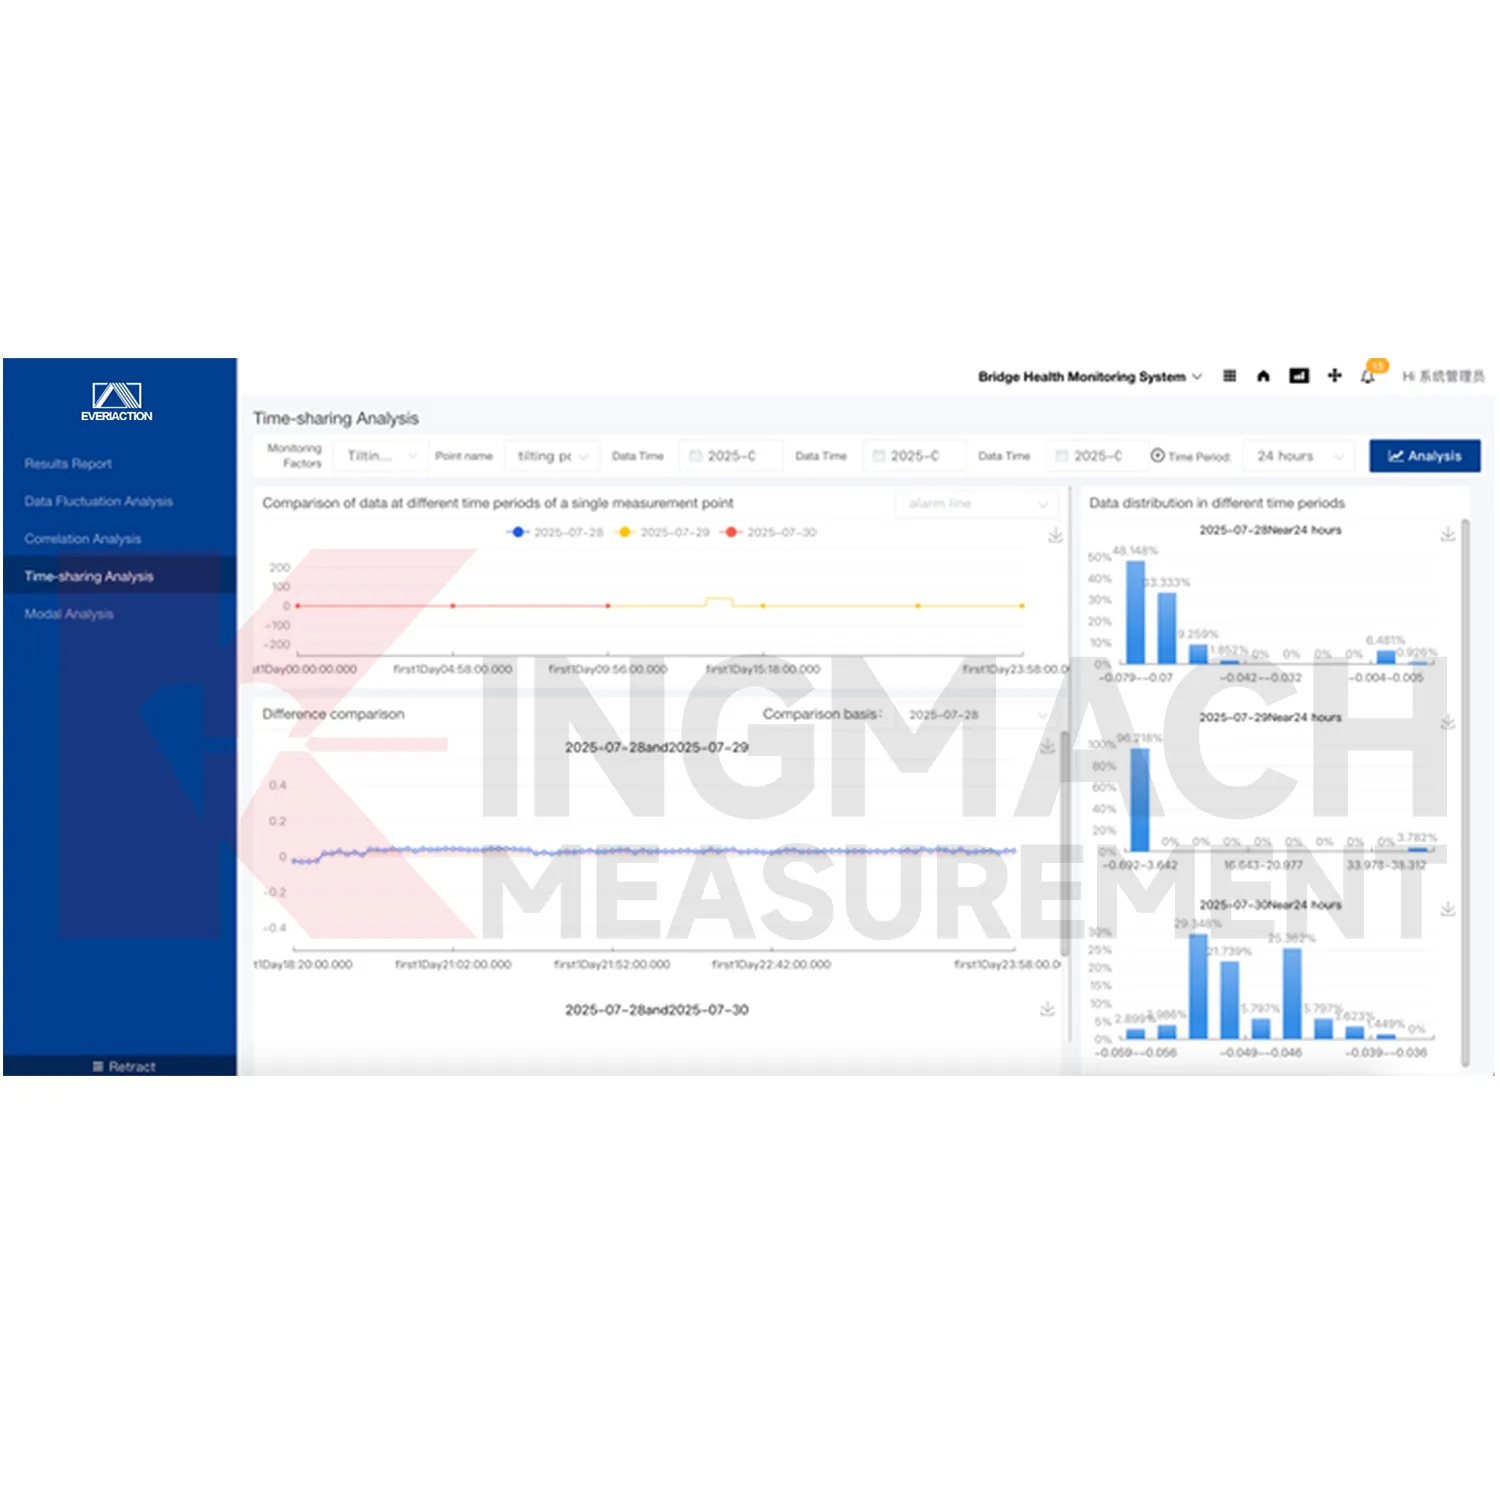
Kingmach Visualization Software includes functions for fast storage, real-time filtering, efficient analysis, complex statistics, user-friendly display, and personalized customization of collected data. These functions help the user move from channel values to engineering understanding. Trend curves can show whether a point is stable, rising, falling, or reacting to weather and construction events. Filtering can reduce distractions before review. Custom display layouts help different users see the data they need for daily operation, risk review, or management reporting.
Application of Visualization Software
Wind tower monitoring uses Kingmach Visualization Software to combine tower tilt, vibration, foundation behavior, strain, wind, temperature, and maintenance records. A tower may respond differently under high wind, temperature change, operation state, and foundation conditions. The platform can visualize trends and preserve event history so reviewers can compare repeated behavior under similar conditions. Alarm configuration helps identify readings that need field inspection without treating every normal operating fluctuation as a fault.
The future of Visualization Software
Cybersecurity and data governance will become more visible around Kingmach Visualization Software. The local product file notes multiple security protocols and transmission methods. As monitoring data moves through cloud systems and remote access points, users will need clearer rules for account access, data storage, document control, alarm review, and report release. Strong governance helps protect the integrity of structural safety records and keeps responsibility clear across owners, operators, and engineering teams.
Care & Maintenance of Visualization Software
Project documents in Kingmach Visualization Software should be kept current. Upload or update drawings, point lists, installation photos, inspection notes, maintenance records, alarm response logs, and report files as the project changes. These documents give meaning to the trend curves and alarm history. If a sensor is moved, replaced, recalibrated, or disabled, the platform record should show the date and reason. Future reviewers need that context to interpret long-term monitoring data correctly.
Kingmach Visualization Software
Kingmach Visualization Software supports remote monitoring by letting data move from devices to the Cloud Platform through wired or wireless transmission. This is important for assets that are hard to access, such as slopes, dams, tunnels, bridges, wind towers, and distributed infrastructure. Remote data does not remove the need for site inspection, but it helps teams decide when inspection is needed and where to focus. Real-time storage and filtering also help preserve event records when weather, construction, traffic, or equipment operation changes the monitoring pattern.
FAQ
Q: Who should receive accounts?
A: Give access only to the owner, operator, engineer, inspector, or reviewer roles that need the platform.
Q: What does an operator need?
A: An operator needs status, active alarms, communication condition, and recent abnormal records.
Q: What does an engineer need?
A: An engineer needs trend comparison, related channels, event notes, and inspection records.
Q: What supports later expansion?
A: Stable project names, point names, device IDs, and channel maps make new device access easier.
Q: What belongs in handover?
A: Provide accounts, permissions, device list, channel map, alarm rules, report setup, backup method, and recent data notes.
Reviews
Andrew Lee
The visualization software is intuitive and powerful. It helps us analyze monitoring data efficiently.
Ryan Lewis
Fast delivery and excellent product quality. The accelerometers and tiltmeters are highly reliable. Strongly recommend this company.
Latest Inquiries
To protect the privacy of our buyers, only public service email domains like Gmail, Yahoo, and MSN will be displayed. Additionally, only a limited portion of the inquiry content will be shown.
Sophia***@gmail.comUnited Kingdom
Good day, we need environmental monitoring sensors including temperature, humidity, and wind sensors...
Isabella***@gmail.comGermany
Hello, we are evaluating weir flow meters for a water management project. Please share accuracy deta...
Related product categories
- Monitoring Software Suite
- Monitoring system software platform
- Environmental Monitoring
- Visualization Software
- GPS Displacement Monitoring System
- Integrated Monitoring Station
- Settlement Monitoring Rod
- Structural Health Monitoring (SHM) System
- Structural Monitoring Cloud Platform
- IoT Online Monitoring System
- Monitoring System Platform & Services
- Engineering Pulse Intelligent Monitoring Cloud Platform